We'll guide you through the process of setting up Chrome UX site search, giving you convenient access to the CrUX dashboard where you'll find analytics about your website. We'll also show you how to use the CrUX API, giving you the option to build more advanced solutions.

Working with CrUX Dashboard
The CrUX Dashboard tool is publicly available and all of the information that you need to pass to it is the URL address of the website you want to audit. However, you need to keep in mind that using any tool that utilizes the CrUX dataset can only be useful for websites that are actually in this dataset.
Furthermore, this tool uses raw origin-level data on BigQuery and visualizes the data for you using various graphs. While it’s useful for creating a detailed analysis, it can only do so for origin URL addresses and not for specific pages.
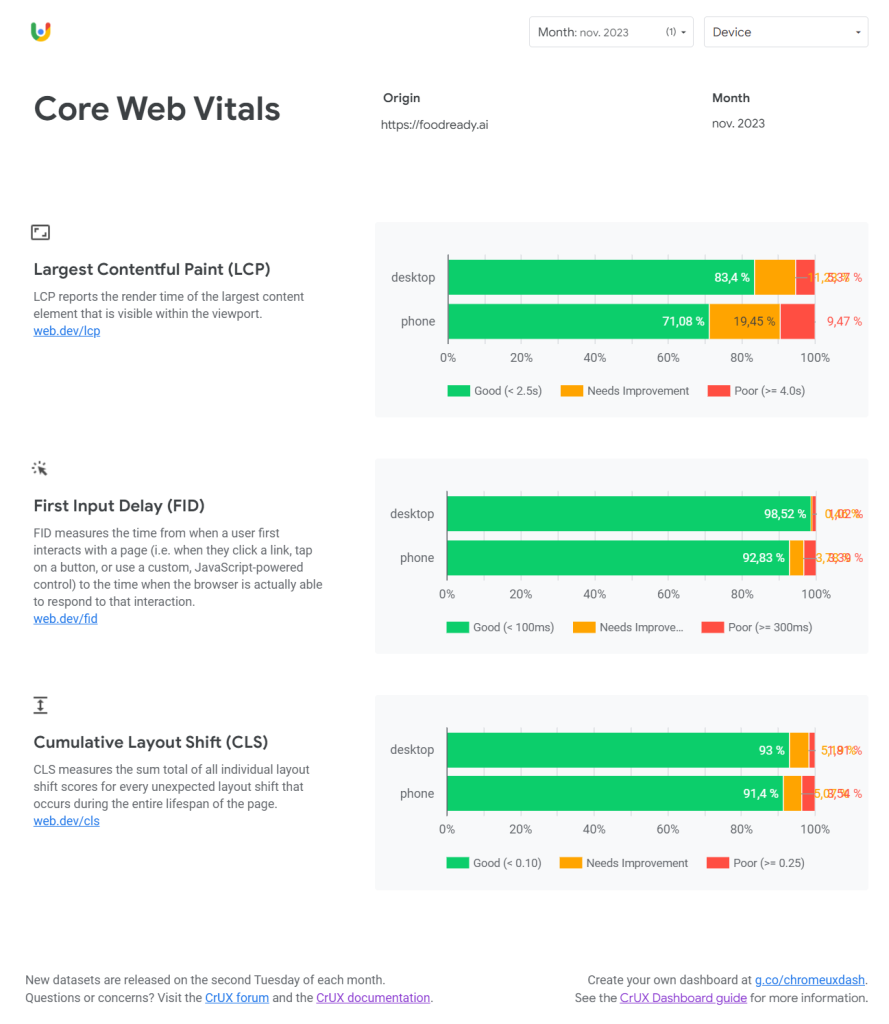
If we give it an example website to audit, you’ll be able to see that the first thing we’re greeted with is the analysis of Core Web Vitals.

You can also hover over each bar segment to clearly reveal the information it’s representing, in case they are overlapping like in this example.
Moreover, you can hone in on specific information by using filters on the top, where you can choose between different devices and time frames or months.
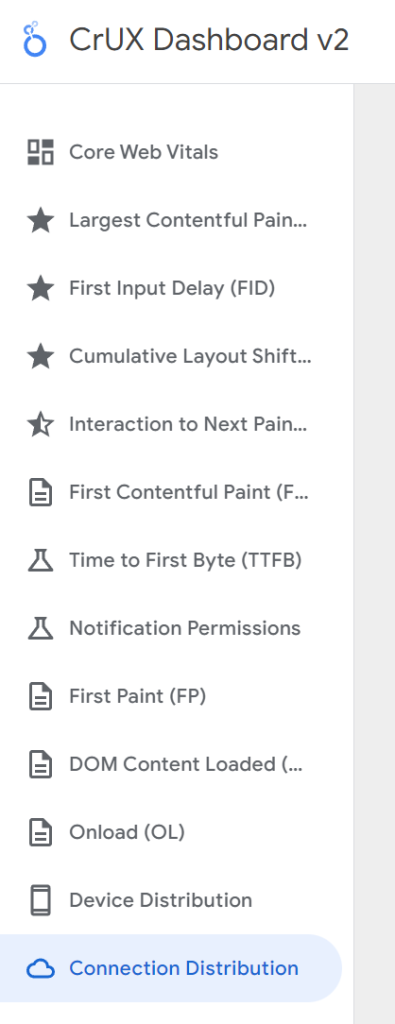
Even more, you can check data on every metric the dataset offers separately, including information about device and connection distribution.

Setting up CrUX site search
We can also set up this tool within our Chrome site search, so we can use it directly from the address bar.
To set it up you need to do the following:
- Navigate to your Chrome Settings by clicking on the three dots in the top right corner and select the Settings option.
- Go to the Search engine tab and open up the “Manage search engines and site search” option.
- Next, you need to scroll down to the Site Search section and click on the Add button, which will open up the following window. In here you’ll need to input the name of this site search option, the shortcut for it and finally, the following URL address: https://lookerstudio.google.com/c/u/0/reporting/bbc5698d-57bb-4969-9e07-68810b9fa348/page/keDQB?params=%7B%22origin%22:%22%s%22%7D
- Lastly, to use this functionality, you need to navigate to the URL address bar, type the shortcut text (crux in our case) and press the tab to activate this site search option.
- Now, you’re ready to input the URL of the website you want to audit and press enter. This will open up the CrUX Dashboard tool for the URL you inputted.
Working with CrUX API
For users, who want to create custom tools for auditing websites using CrUX dataset, we can fetch data using POST requests, which we can then process further.
One big advantage it offers us is that it will output performance metrics for the last 28 days, regardless if we’re making the request in the middle of the month.
However, you need to keep in mind that it does take approximately 2 days to process and include the data in the API, so you can’t expect to get live data.
In the following guide, we’ll demonstrate how to make such requests using Python and how to visualize metric data with the matplotlib module.
But before we can start coding, the first thing we need to take care of is to set up the CrUX API within Google Cloud Console.
To do this, you need to follow the next couple of steps:
- Create a project on Google Cloud Console
- Go to APIs & Services and find Chrome UX Report API in the API library and enable it
- Navigate to the Credentials tab and create an API key by clicking on the Create credentials button and selecting API key option
- Copy that API key and save it somewhere safe
Alright, now we’re finally ready to put it to use. We recommend you download the contents of the GitHub repository accompanying this post, where we demonstrate how you need to structure the data we send with the POST request, filter the response data and visualize it with histograms for mobile and desktop environments separately.
But before you try it out, you also need to create a file named .env in the same directory as the main project file and paste your API key inside like the following line.
CRUX_KEY=<your API key>
Now you can use the script directly from the command line by using the following command.
python main.py -u https://example.com
Conclusion
To conclude, we checked out a couple of different ways we can track performance using Chrome UX report dataset. Moreover, we went through the functionalities of CrUX Dashboard tool, which is a very user-friendly option and we also touched upon the workings of CrUX API, which gives us the power to complicate things to our heart’s content.
